In Google’s Site Reliability Engineering book, the chapter on toil (tedious, manual operational work) asserts that we should keep toil work amounts to only a small fraction of our total engineering hours. The reason for this is that too much toil work negatively impacts the engineering team.
In this post we will review some toil basics, talk about why toil tracking matters, and see how we can leverage Azure DevOps to track and classify our sprint work for enhanced toil budget tracking.
What is toil?
The toil chapter in the SRE book covers this pretty well, so I highly recommend you read that before continuing. However the Cliff’s notes version is as follows:
Toil is the kind of work tied to running a production service that tends to be manual, repetitive, automatable, tactical, devoid of enduring value, and that scales linearly as a service grows.
Google SRE
Why should we track it?
Morale: The more time an engineer spends on toil work, the less time they are able to spend on real engineering work (ex: planned sprint work). If you continually pull engineers away from normal engineering work they will understandably get frustrated and eventually burn out.
Team Velocity: The more time we waste on throwaway work with no enduring value, the less capacity the business has for real planned work that actually delivers value. Since toil typically scales up with the size of production services, the amount of toil will grow over time if we aren’t actively writing automation to keep it in check.
Planning Benefits: If we set a set toil budget (ex: no more than 35% of engineering hours) and track our toil hours, then we can make better planning decisions. For example if we blow the toil budget in Q1, then Q2 should prioritize automation (toil-reduction) over regular feature work to get us back in balance.
Tracking toil with incident management systems
Let’s assume you have now decided to track toil hours for your engineering organization. If you use an incident management system for your production services, then you now have a huge source of data for your toil budget.
Every incident that comes in is automatically classified as toil– because this is interrupt driven, production/operational work. Using your incident management system’s API or data export features, you would grab the incident data and chart how many hours of toil work were completed by each engineer over the last quarter, for example.
If we only look at our incident management system, then we have to guess or make assumptions about how we spend the remaining work hours. Assuming you also use a work item tracking system, we can leverage that too for an enhanced view of toil stats.
The remainder of this post focuses on how to accomplish that using Azure Boards work item tracking.
Defining toil tracking categories
Before we can make changes to our sprint boards for work item classification, we need to define some categories for tagging non-incident work.
I find that sprint work generally falls into one of the following three categories:
1. Regular work: includes writing new software features, fixing bugs, writing unit tests, writing documentation, meetings, design discussions, code reviews, etc.
2. Toil work: includes handling production incidents, running release deployments, conducting maintenance windows, setting up environments, fixing CI pipeline breaks, etc.
3. Toil reduction: includes work on deployment frameworks/tools, self-healing service automation, scripts for certificate and key rotations, etc.
Adding a toil tracking field to work items
Now that we have defined a few categories, lets add that classification as a new field in the work item tracking system.
1. Find your project level settings. In the project sidebar in Azure DevOps, it can be found at the very bottom as Project settings with a little gear icon.
2. On the Overview tab from the Project settings page, click on the process model associated with your team project.
Important: You cannot modify the base process models built into Azure DevOps. If you are using a base process model such as Scrum, Agile, or Basic — you will need to switch to using a custom process that inherits from a base process. This will allow you to modify the process details. See this tutorial if you need to change the project’s process to a new custom process.
Note: Performing these updates requires Project Collection Administrator access in your Azure DevOps project (or have Allow permissions to edit processes).
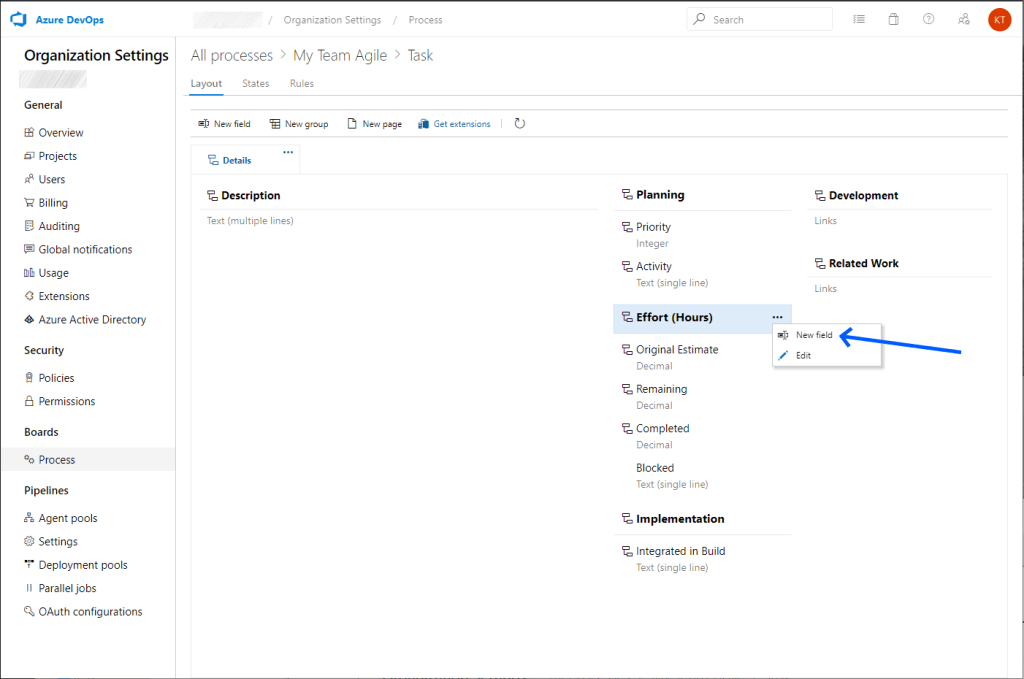
3. Click on the work item definition for Task.
4. Hover over the group section that you would like to add the field to (for example the Effort group), and click New field.
5. On the Add a field to Task pop-up, select Create a field. Make a field type of ‘picklist’ with the categories we defined earlier. I named my new field Classification.

6. Repeat the same steps above for the Bug work item template. However instead of creating a new field, select Use an existing field to browse and find the Classification field that was already created for tasks.
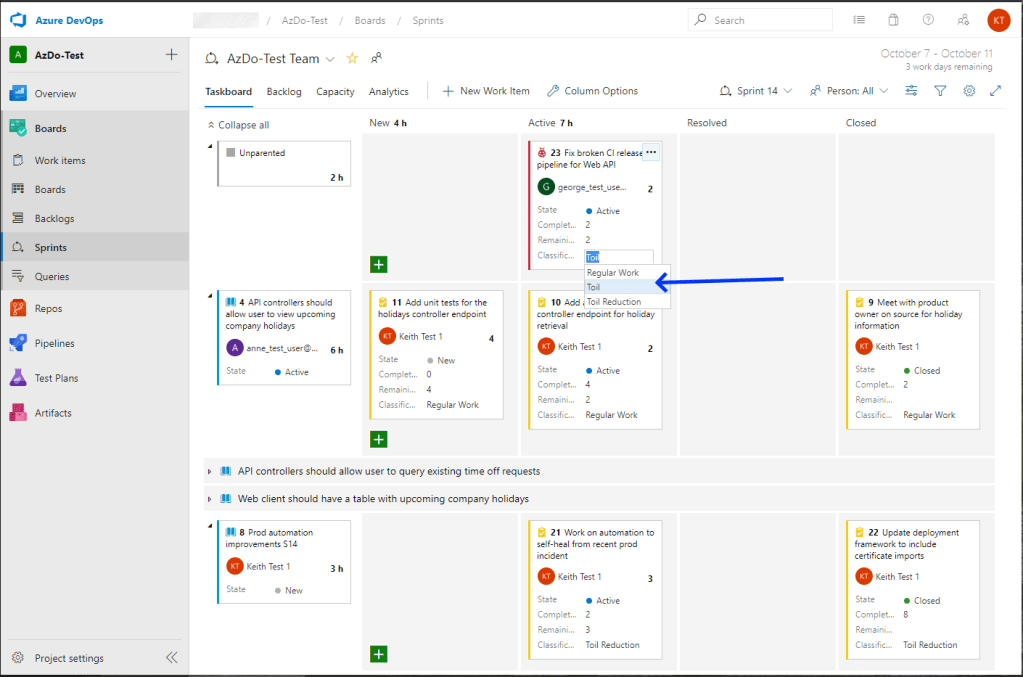
7. Then head over to your sprint board and add the new field to your sprint board tile cards. Click on the Settings gear icon on the board, then add the Classification field to both Task and Bug tiles.


After the above steps are completed, you can start tagging items as regular work, toil, or toil-reduction– directly from the sprint board (or from the work item view).
Work item queries
Using Azure Boards query features, its easy to build custom queries to help you find items that need tagging, or find the work items that can be used in toil stats reporting. You can manually build queries in the query editor in the browser. It also includes an Export to CSV button on query results.
For automated data export you can leverage the Azure DevOps API to execute queries. The query API reference information can be found here. Let’s take a look at a couple examples written in the Azure DevOps work item query language (WIQL).
Important: You will need to replace the Project Name, Team Name, and ID with values from your environment.
1. Find all items in the current sprint that need a classification tag:
select [System.Id], [System.WorkItemType], [System.Title], [System.AssignedTo], [System.State], [System.Tags]
from WorkItems where [System.TeamProject] = @project
and [System.WorkItemType] in ('Bug', 'Task')
and [System.IterationPath] = @currentIteration('[AzDo-Test]\AzDo-Test Team <id:bee58faa-5a03-4187-93b7-3fcf06d1c9df>')
and [Custom.Classification] = ''"
2. Find completed items in the current sprint that can be used for toil stats reporting:
select [System.Id], [System.WorkItemType], [System.Title], [System.AssignedTo], [System.State], [Microsoft.VSTS.Scheduling.CompletedWork], [Custom.Classification], [System.Tags]
from WorkItems where [System.TeamProject] = @project
and [System.WorkItemType] in ('Bug', 'Task')
and [System.State] = 'Closed'
and [System.IterationPath] = @currentIteration('[AzDo-Test]\AzDo-Test Team <id:bee58faa-5a03-4187-93b7-3fcf06d1c9df>')
and [Custom.Classification] <> ''"
Reporting on toil stats
After we have exported the work item data at the end of the sprint or release, we can combine it with data from the incident management system and then plug it all into a reporting application.
For demonstration purposes I just opened up PowerBI desktop to make some quick charts with the work items data from this post (no incident management system data).
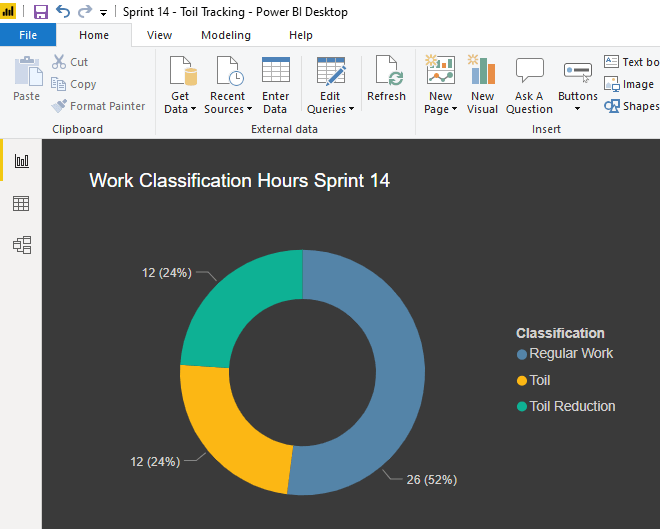
How you splice and visualize that data is up to you, but there are some cool things to report on if we have both the incident management system’s data and the data from our sprint boards.
A few questions you can answer with reporting software:
- How much time did we spend on toil hours, compared to other work?
- How distributed is toil work across team members?
- How distributed is toil work across multiple sprints?
- How much toil is coming from our incident management system vs sprint work?

One thought on “Tracking and classifying Azure DevOps work items in SRE toil budgets”