Power BI makes it really easy to import data, create reports with rich visuals, and then gain insights to make decisions. However one of the tricky things that I found when learning Power BI was that most of the example datasets were for sales and marketing data.
When should you use a bar chart? A donut chart? A funnel chart? Existing tutorials answer these questions fine– but what if you have telemetry or metrics for software projects?
In this post I share some Power BI chart and data model examples that are bit more relevant for software engineers. This makes it easier to build the best possible dashboards for your software or production systems telemetry.
Power BI chart selection examples
When it comes to Power BI basics and selecting the right visuals (charts) for each data category, I learned a lot from Microsoft Power BI Dashboards Step by Step by Errin O’Connor.
I constructed this table with information from that book along with trial and error for software telemetry/metrics. This table is by no means exhaustive, but it should provide a helpful starting point for choosing the right chart for your metric or dataset.
The key to proper chart selection is to identify the focus of the data that you want to display. Is the visual going to be focused on incremental changes? Is it time-series based? Is it hierarchical? Once you have determined its key focus (classification), it becomes easy to select a chart based on the table below.
| Data types | Example Scenarios | Power BI Charts |
|---|---|---|
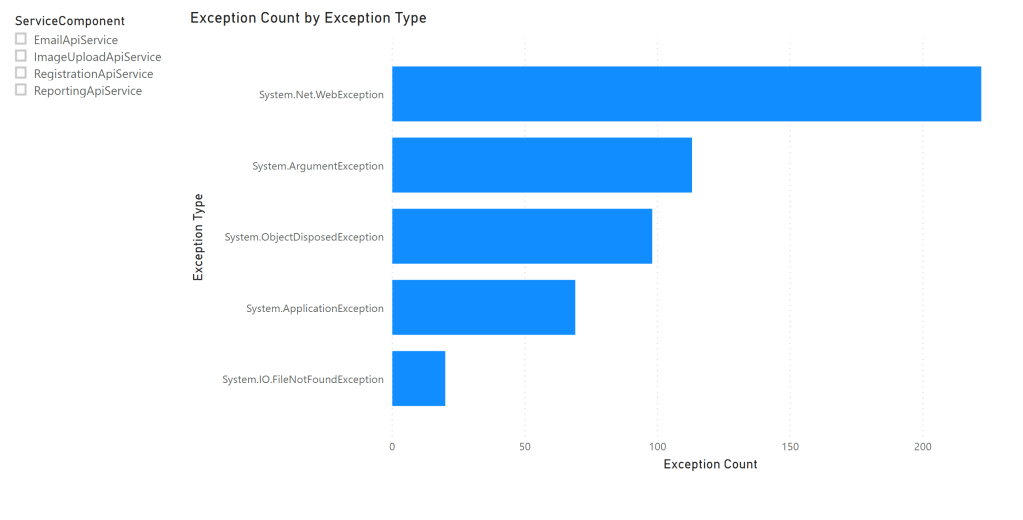
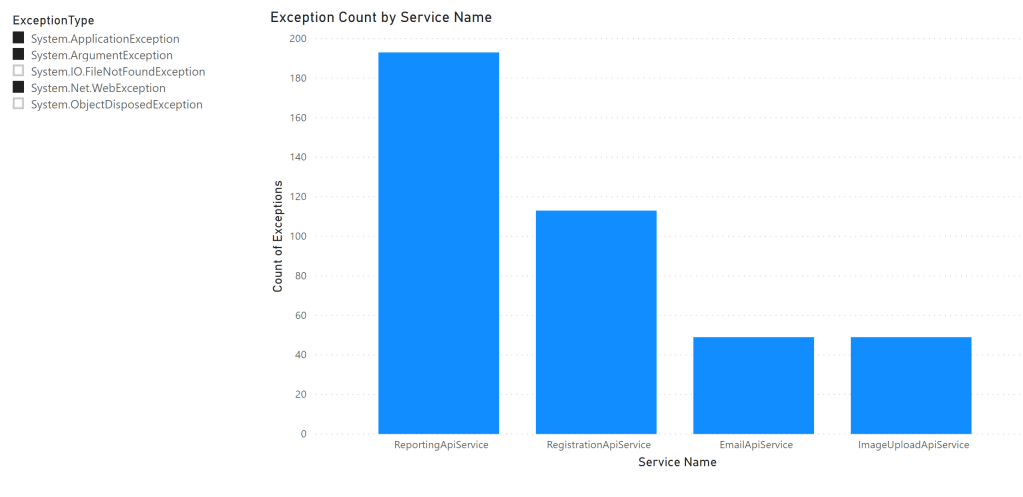
| Categorical data | • Exception count by exception type • Exception count by service name • Service response time (latency) by service name | • Stacked Bar/Column chart • Clustered Bar/Column chart • 100% stacked bar chart • Ribbon chart |
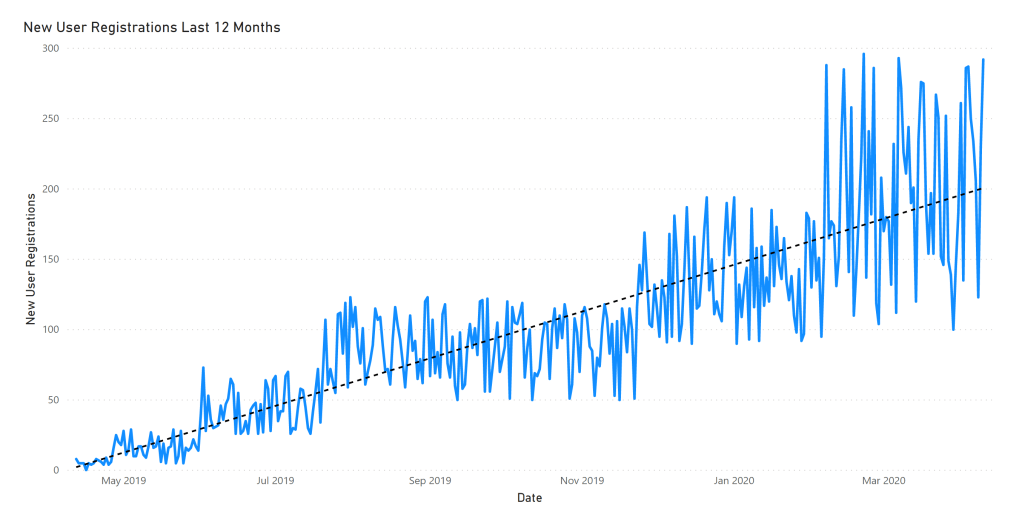
| Time based data (Data that changes over time) | • New user registrations over rolling 12 month window • Year-to-date (YTD) live-site / production incidents | • Line chart • Area chart • Stacked area chart • Combo line/column charts |
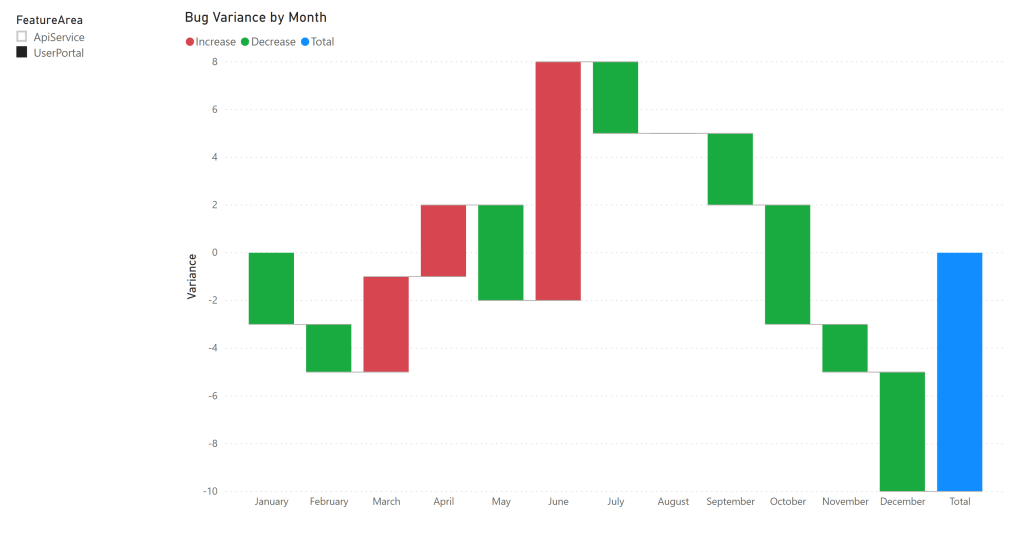
| Incremental changes (Running totals as values are added or subtracted showing progress) | • Month-over-month count/variance of open bugs | • Waterfall chart |
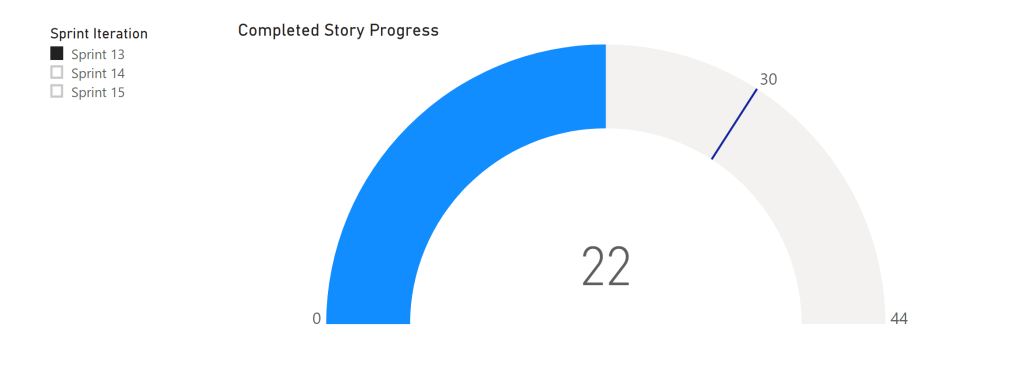
| Progress data (Progress towards a goal or KPI shown as a circular arc) | • Number of user stories completed against the sprint goal | • Gauge chart |
| Hierarchical data | • Storage capacity utilized by database cluster and database name | • Treemap chart |
| Related number sets (X,Y) (Shows the relationship between 2 (scatter) or 3 (bubble) numerical values) | • Requests per hour with average latency, grouped by service component | • Scatter chart • Bubble chart |
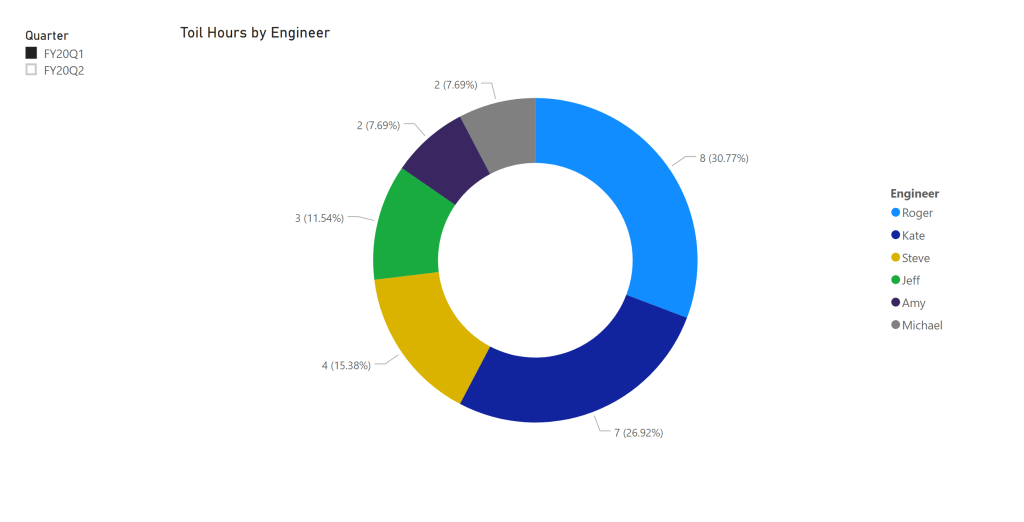
| Proportional data (Illustrates proportion or percentage of whole) | • Service toil hours by engineer | • Pie chart • Donut chart |
| Linear data (connected stages) | • User registration/signup flow tracker | • Funnel chart |
| Scalar values | • Service component uptime percentage | • Cards • Multi-row cards |
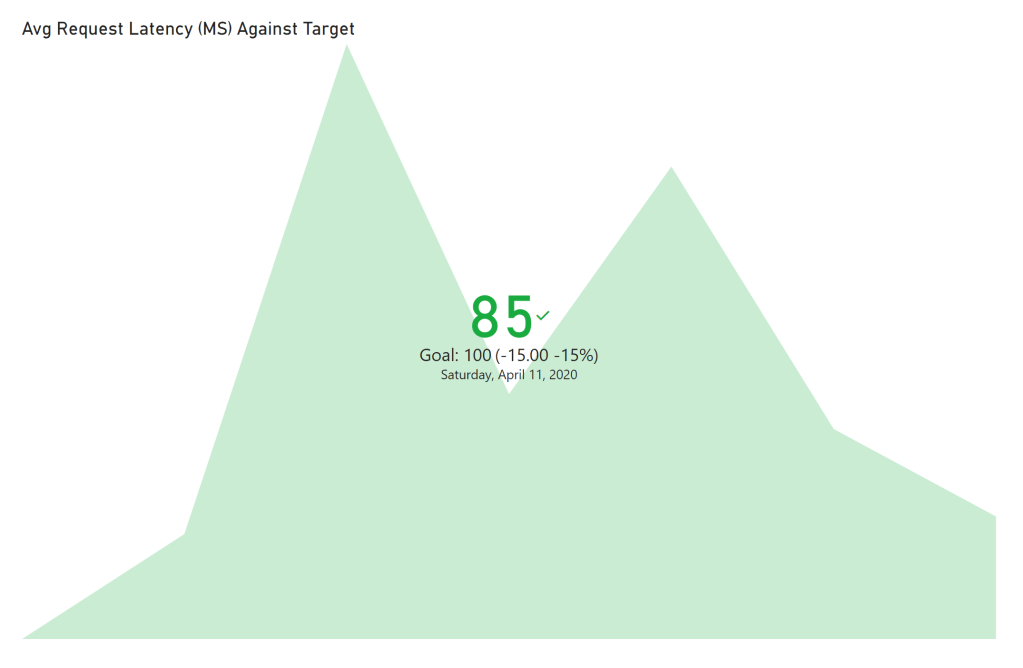
| Target measure / thresholds | • Average request latency time against target • Service throughput/saturation against capacity limits | • KPI chart |
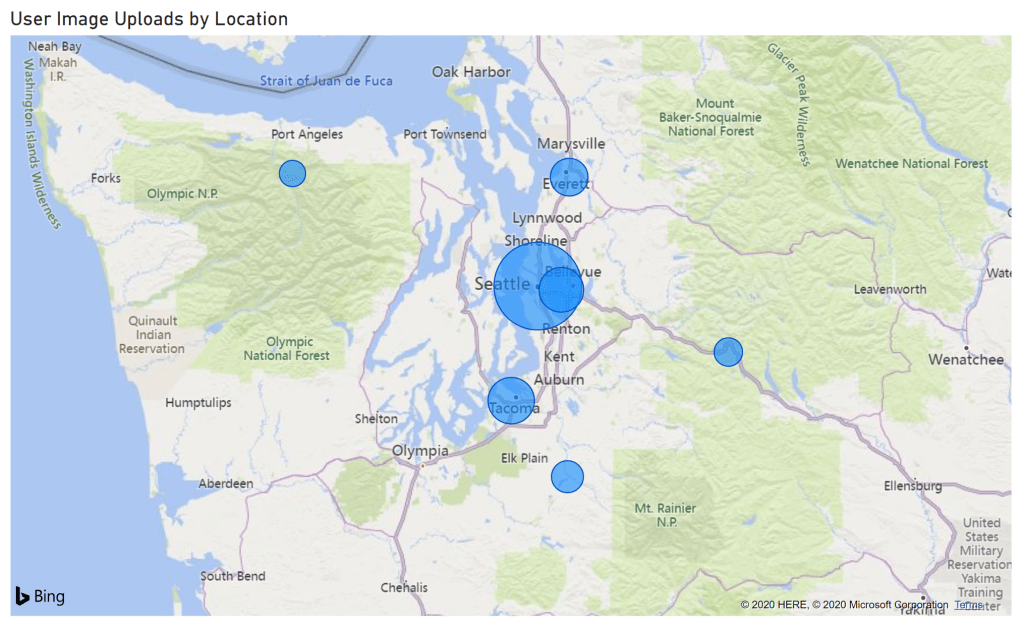
| Geospatial data | • Number of image uploads by geolocation | • Bubble map • Filled map • ArcGIS map |
Example data models
Modeling the underlying data source for each chart type can be confusing. To help you get started I have posted all of the .csv files used below on this Github repo.
These .csv files contain just the minimal amount of fields to construct the charts– all other non-relevant items are removed. This should make it easier to understand which fields are truly necessary to build charts. Real production telemetry would contain significantly more fields and data.
Example chart screenshots
For illustration purposes I have included screenshots for many of the Power BI charts referenced in the table above. In case you don’t know what the funnel chart is supposed to look like for example, you can see it here.
Note: Some of the charts below use slicers. These are optional visuals that help ‘slice’ your data by an additional dimension and you can watch the chart visual change in real time.
Bar chart (categorical data example 1)
Column chart (categorical data example 2)
Same underlying .csv data as previous chart, just sliced and displayed differently.
Line chart (time based data)
Waterfall chart (incremental data)
Gauge chart (progress data)
Treemap chart (hierarchical data)

Bubble chart (related number sets data)

Donut chart (proportional data)
Funnel chart (linear stages data)

Card chart (scalar value data)

KPI chart (target measure / thresholds data)
Bubble map chart (geospatial data)